Visualizations
Data Analysis
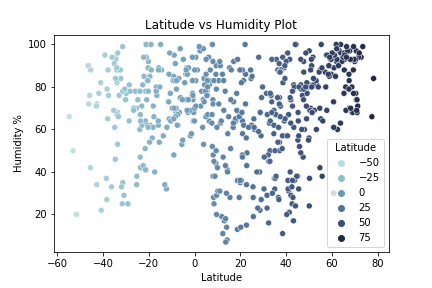
Again, not a super conclusive chart/graph, however you can see some clustering in the top left and top right, and that may indicate that the trend is toward more humidity the more north and south you go.

Analysis based on Chart Data
Again, not a super conclusive chart/graph, however you can see some clustering in the top left and top right, and that may indicate that the trend is toward more humidity the more north and south you go.
