Visualizations
Data Analysis
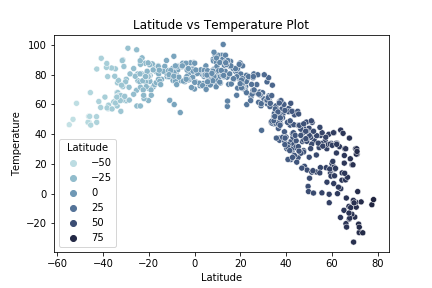
With this temperature plot, it looks as though as the latitude increases, the temperature drops off.

Analysis based on Chart Data
With this temperature plot, it looks as though as the latitude increases, the temperature drops off.
